| Page |
|
Exercise 1
1.
The following table shows the daily sales of pints of milk at a grocer's shop
over a four-week period.
Sun
Mon
Tue
Wed
Thur
Fri
Sat
13
9
7
10
5
12
16
12
8
8
7
4
16
15
15
10
8
8
6
13
15
12
13
9
8
5
15
19
a) Draw and label a time-series line graph using the above data.
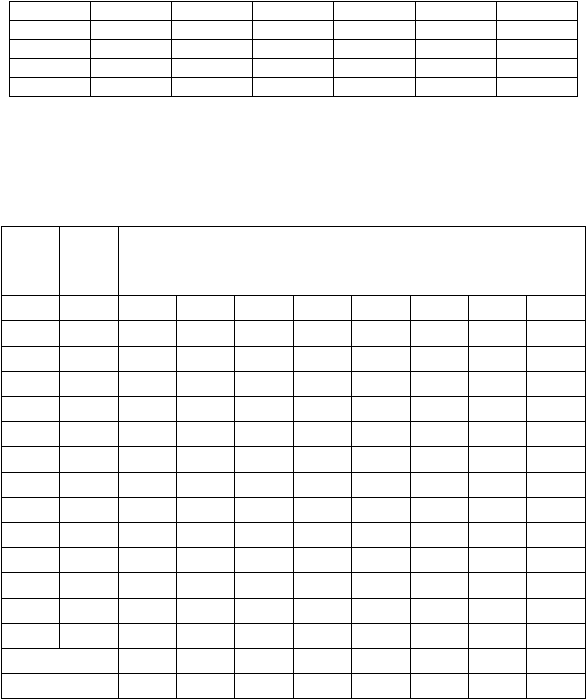
b) Complete the moving averages table for days 1 to 14 (shown below).
Table for days 1 to 14
Days
of
week
Pints
of
milk
Moving average calculations
1
13
13
2
9
9
9
3
7
7
7
4
10
10
10
5
5
5
5
6
12
12
12
7
16
16
16
8
12
12
12
9
8
8
10
8
8
11
7
7
12
4
4
13
16
16
14
15
15
Totals
72
71
70
Averages
10.3
10.1
10